
TL;DR:
- Profit optimization in Forex trading involves systemically maximizing returns through position sizing, stop-loss placement, and strategy validation to prevent account blowouts. Combining ATR-based sizing, disciplined risk limits, and walk-forward analysis ensures a sustainable and validated trading edge, emphasizing the importance of expectancy over win rate. Regular re-optimization and integrated strategies, including machine learning and robust risk controls, are essential for consistent long-term profitability.
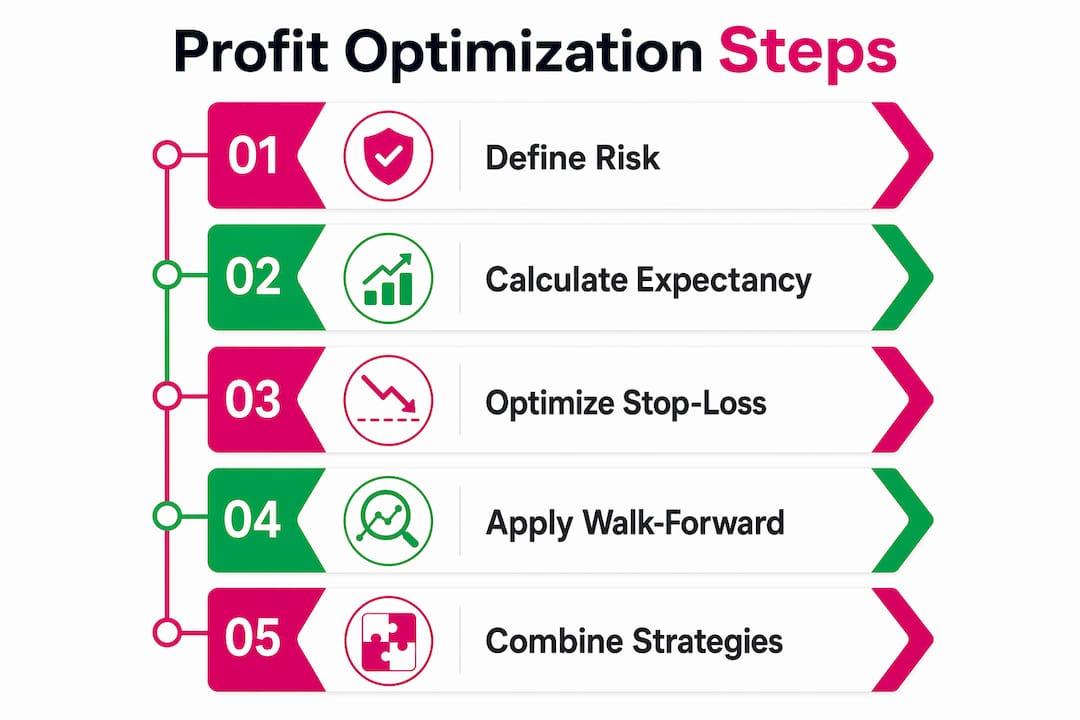
Profit optimization in Forex trading is defined as the systematic process of maximizing expected returns per unit of risk through position sizing, stop-loss placement, expectancy engineering, and strategy validation. These are not abstract concepts. They are the specific levers that separate accounts that grow from accounts that blow up. This guide covers the core profit optimization methods forex traders actually use in 2026, from ATR-based sizing formulas to walk-forward analysis on MetaTrader 5, with concrete implementation details at every step. Past results do not guarantee future performance.
What are the most effective profit optimization methods in forex?
Position sizing is the single most controllable variable in your trading system. Get it wrong and no edge survives. Get it right and even a modest edge compounds reliably over time.
The three most practical approaches are:
-
ATR-based dynamic sizing. The ATR sizing formula calculates lot size as:
risk_amount / (stop_distance × tick_value), wherestop_distance = ATR × multiplier. This adjusts your position size automatically when volatility expands or contracts. A production-ready implementation must also account for broker lot rounding, minimum and maximum lot constraints, and contract size differences across instruments. -
Fixed fractional risk. Risking a fixed 1–2% per trade is the most widely validated approach for managing drawdowns while allowing your edge to express over a large sample of trades. Risking more than 2% per trade accelerates account recovery requirements exponentially after losing streaks.
-
Portfolio-level risk caps. When you hold multiple open trades simultaneously, individual position risk compounds. A cap of 5–6% total open risk across all positions prevents a correlated move from wiping out weeks of gains in a single session.
The most common mistake traders make is ignoring broker lot step constraints. If your formula outputs 0.37 lots but your broker rounds to 0.40, you are taking on more risk than planned. Always build rounding logic into your sizing system.
Pro Tip: When running multiple correlated pairs like EUR/USD and GBP/USD at the same time, treat them as one position for risk cap purposes. Their correlation means a single macro event can move both against you simultaneously.

How do stop-loss placement and exit strategies impact forex profit optimization?
Exit rules determine your realized expectancy more than entry signals do. Most traders spend 90% of their optimization effort on entries and almost none on exits. That is backwards.
The main stop-loss types each serve a different purpose:
- Fixed pip stops work in low-volatility, range-bound conditions where price action is predictable within a defined band.
- ATR multiple stops adapt to current market conditions. Swing trading strategies typically use stops around 1.5–2× ATR with targets at 2:1 to 3:1 risk-reward. This approach keeps you in trades long enough to capture meaningful moves without getting stopped out by normal noise.
- Trailing stops lock in profits as price moves in your favor. They work best in trending conditions and poorly in choppy markets where price reverses frequently.
Exit parameter sweep testing is one of the most underused tools in Forex. About 60% of strategies show an improved Sharpe ratio when exit parameters are tuned separately from entries. That means testing different stop distances, take-profit levels, and holding durations systematically rather than guessing. You can explore exit strategy refinement to see how automated tools handle this in practice.
Time-based exits add another layer. Holding a trade past a defined duration, say 48 hours for a day trade setup, often means the thesis has expired. Cutting positions based on time, not just price, reduces the drag of dead trades on your capital.
Pro Tip: Re-optimize your exit parameters every 3–6 months. Market regimes shift. A stop distance that worked well in a trending EUR/USD environment will underperform in a mean-reverting one.
Why is expectancy the core metric for sustainable forex profit optimization?
Expectancy is defined as the average dollar amount you gain or lose per trade, calculated as: (Win Rate × Average Win) − (Loss Rate × Average Loss). A positive expectancy means your system makes money over a large sample. Win rate alone tells you nothing about profitability.
The relationship between risk-reward ratio and breakeven win rate is what most traders miss. At a 1:2 risk-reward ratio, your breakeven win rate is 33.3%. You can lose two out of every three trades and still make money. This is the core logic behind asymmetric trading systems.
| Risk:Reward Ratio | Breakeven Win Rate | Implication |
|---|---|---|
| 1:1 | 50.0% | Must win half of all trades |
| 1:2 | 33.3% | Profitable with only one win in three |
| 1:3 | 25.0% | One win in four is enough to break even |
| 2:1 | 66.7% | Requires high accuracy to stay profitable |
Adding filters improves expectancy further. Regime filters, volume conditions, and news avoidance windows can improve expectancy by 30–100% by removing low-quality setups from your trade sample. Fewer trades with higher average quality beats more trades with diluted quality every time.
To measure your expectancy accurately, you need at least 100 trades in your sample. Fewer than that and variance dominates the result. Track your average win, average loss, and win rate separately so you can identify which variable is degrading when performance slips.
How can walk-forward analysis improve forex profit optimization?
Walk-forward analysis (WFA) is the process of repeatedly optimizing a strategy on an in-sample window, then testing it on the adjacent out-of-sample window, and sliding both windows forward through time. It is the most reliable method for detecting whether your optimization results reflect a real edge or just curve-fitting to historical noise.
The three main WFA structures are:
-
Single split. One in-sample period followed by one out-of-sample period. Simple but limited. A single split cannot tell you whether performance is consistent across different market regimes.
-
Rolling windows. Both windows slide forward together, keeping a fixed length. This tests whether the strategy adapts to changing conditions and is the most common structure for Forex EAs.
-
Anchored windows. The in-sample start date is fixed while the end date extends forward. This is useful when you want to test whether adding more data consistently improves robustness.
Walk-forward analysis reduces overfitting by forcing your parameters to perform on data they were never trained on. MetaTrader 5’s Forward Optimization feature runs a forward test alongside the optimization automatically, flagging strategies where in-sample results do not carry over. That is a fast way to filter out curve-fitted systems before you risk real capital.
The practical rule: re-optimize your parameters every 3–6 months using a rolling WFA structure. Markets shift. Parameters that were optimal in 2024 may be suboptimal in 2026. Treating optimization as a one-time event is one of the most expensive mistakes in systematic trading.
Which combined forex strategies deliver the best profit optimization results?
No single technique produces the best results in isolation. The traders who consistently grow accounts combine position sizing, exit optimization, expectancy controls, and validation into one integrated system.
| Approach | Strength | Key Risk |
|---|---|---|
| Genetic algorithm optimization | Finds non-obvious parameter combinations | Strong in-sample, weak out-of-sample without validation |
| Machine learning frameworks | Captures complex nonlinear patterns | Overfits without rigorous out-of-sample testing |
| Classical risk controls | Proven, interpretable, low overfitting risk | May underperform in fast-changing regimes |
| Hybrid (ML + classical risk) | Combines pattern recognition with risk discipline | Complexity increases implementation error risk |
Genetic algorithm optimization of RSI and ADX parameters is a clear example of why validation matters. Research shows in-sample returns of +18.73% can flip to out-of-sample losses of 20.42% when slippage and regime shifts are not accounted for. Past results do not guarantee future performance. The optimization found a pattern that existed in the past but did not persist.
Machine learning frameworks evaluated on ROI and Sharpe ratio, rather than prediction accuracy alone, show more promise. Trading metrics like ROI and Sharpe align model selection with actual profitability rather than statistical fit. This is the right way to evaluate any model you plan to trade with real money.
Carry trades add another layer of complexity. Broker swap markups absorb 30–50% of theoretical carry returns, which means position sizing for carry strategies must account for unwind risk, not just the expected daily carry. Ignoring swap costs in your expectancy calculation produces an overstated edge.
The most durable combined approach pairs a validated entry signal with ATR-based sizing, a regime filter to improve expectancy, and walk-forward validation to confirm the edge persists. You can find a broader overview of trading resource optimization that covers how these components fit together.
Key takeaways
Sustainable Forex profit optimization requires positive expectancy, disciplined position sizing, and continuous walk-forward validation working together as one system.
| Point | Details |
|---|---|
| Position sizing is foundational | Use ATR-based dynamic sizing and cap total open risk at 5–6% across all positions. |
| Exits drive realized expectancy | Tune stop-loss, take-profit, and holding duration separately from entries using parameter sweep testing. |
| Win rate alone is misleading | A 1:2 risk-reward system breaks even at a 33.3% win rate, so focus on expectancy, not accuracy. |
| Walk-forward analysis prevents overfitting | Roll your in-sample and out-of-sample windows forward every 3–6 months to confirm your edge persists. |
| Combined methods outperform single techniques | Pair ML or genetic algorithm signals with classical risk controls and rigorous out-of-sample validation. |
What most traders get wrong about profit optimization
I have watched traders spend months optimizing entry signals down to the pip while leaving their exit rules completely untouched. That is the wrong priority. In my experience, the exit side of a trade accounts for more variance in final P&L than the entry side does. A mediocre entry with a well-structured exit often outperforms a precise entry with a sloppy one.
The other mistake I see constantly is treating a single backtest as proof of edge. Genetic algorithm results that show strong in-sample performance can flip to significant losses out-of-sample, as the research confirms. One backtest tells you what worked in the past on that specific data set. Walk-forward analysis tells you whether the edge is real.
My honest recommendation: build your system around expectancy first. Define your risk-reward target, calculate the breakeven win rate, and then test whether your entry signal actually clears that bar on out-of-sample data. If it does not, no amount of parameter tuning will save it.
Position sizing discipline is the last piece most traders underestimate. Kelly sizing sounds mathematically optimal, but its assumptions rarely hold in live Forex trading. Dynamic de-risking aligned with your remaining drawdown budget is safer and more practical than fixed Kelly fractions. Keep your per-trade risk at 1–2% and your portfolio risk cap firm. The compounding effect of avoiding large drawdowns is more powerful than chasing larger position sizes.
If you are running multiple accounts, automation matters. Manually replicating a validated strategy across several accounts introduces execution errors that degrade your realized expectancy. That is where a reliable trade copier becomes a practical tool, not a luxury.
— Rimantas
Replicate your optimized strategy across multiple accounts
Once you have a validated strategy with solid expectancy and disciplined position sizing, the next challenge is executing it consistently across more than one account without manual re-entry errors.
Mt4copier’s Local Trade Copier runs entirely on your Windows machine or VPS, copying trades from a master account to multiple client accounts in under 0.5 seconds with no cloud routing. It includes 18 lot size and risk management options, automatic lot scaling per account balance, and a stop-loss and take-profit waiting feature that holds copy execution until your exit parameters are confirmed. Mt4copier supports MT4, MT5, and DXTrade under one subscription. Over 3,000 traders have used it since 2010, with 491 Trustpilot reviews. Start with a 7-day free trial and see how it fits your workflow.
FAQ
What is the best position sizing method for forex?
ATR-based dynamic sizing is the most adaptable method because it adjusts lot size to current market volatility. Pair it with a fixed 1–2% risk per trade and a portfolio cap of 5–6% total open risk.
How do i calculate expectancy in forex trading?
Expectancy equals (Win Rate × Average Win) minus (Loss Rate × Average Loss). A positive result means your system is profitable over a large sample, regardless of win rate.
What is walk-forward analysis and why does it matter?
Walk-forward analysis repeatedly tests optimized parameters on out-of-sample data by sliding the validation window forward through time. It is the most reliable way to confirm your strategy has a real edge rather than a curve-fitted one.
How often should i re-optimize my forex strategy?
Re-optimize every 3–6 months using a rolling walk-forward structure. Market regimes shift, and parameters that worked in one environment often underperform in another.
Can machine learning improve forex profit optimization?
Machine learning frameworks evaluated on trading metrics like ROI and Sharpe ratio can identify complex patterns, but they require rigorous out-of-sample validation to avoid overfitting. Past results do not guarantee future performance.
Recommended
- What Is Trading Resource Optimization for Forex Traders
- Forex Trading For Beginners: 3 Profitable Strategies For 2023
- A Forex Trade Management Strategy To Get More Profit