TL;DR:
- Most traders overlook hidden costs like spreads, slippage, and timing losses, which often exceed broker commissions. Improving trade execution by choosing optimal session times, using limit orders, and evaluating total costs significantly enhances trading efficiency and profits. Regular measurement and strategic cost management prevent leaving substantial money on the table in active trading.
Most traders spend hours analyzing charts but barely glance at their trading costs. That’s a problem, because what is trading cost efficiency really about? It’s about measuring how much of your gross profit the market actually lets you keep after all costs are paid. Not just the commission line on your broker statement. The full picture: spreads, slippage, margin interest, session timing, and a dozen other factors that quietly drain your account. This article breaks down every component, explains what drives those costs up or down, and gives you practical steps to keep more of every trade you win.
Key Takeaways
| Point | Details |
|---|---|
| Hidden costs dwarf commissions | Spreads, slippage, and timing losses often cost more than visible broker fees. |
| Session timing is a free lever | EUR/USD spreads can be 10x higher in Asian sessions vs. the London-New York overlap. |
| Zero-commission is rarely zero-cost | Zero-commission accounts frequently add 50-70% more in total execution costs through wider spreads. |
| Limit orders cut spread costs | Switching 50% of market orders to limit orders can halve your spread costs per lot. |
| Measure before you cut | Use execution benchmarks and the Efficiency Trading Statistic to identify where costs actually hurt most. |
What trading cost efficiency really means
Trading cost efficiency is the ratio between what you pay to execute a trade and what that execution should theoretically cost in a frictionless market. When your actual costs are close to the theoretical minimum, you’re efficient. When they’re not, you’re leaving money on the table with every click.
Most traders think in terms of explicit costs. These are easy to see:
- Commissions and ticket fees charged by your broker per lot or per trade
- Platform or data subscription fees billed monthly regardless of activity
- Taxes and regulatory charges applied in certain jurisdictions
The more dangerous category is implicit costs. These never appear as a line item, yet they consistently outweigh commissions for active traders:
- Bid-ask spreads: The gap between the buy and sell price you pay every time you enter or exit
- Slippage: The difference between your intended fill price and your actual fill price, especially during volatile moments
- Market impact: Your own order moving the price against you, most relevant for larger position sizes
Traders tend to focus excessively on commissions while ignoring silent cost killers like slippage, which often carry a larger drag on net results. A broker charging $7 per lot with a 0.2 pip spread may cost you less than a “zero-commission” broker with a 1.5 pip markup on every trade.
The efficiency ratio concept adds another dimension. In systematic trading, the efficiency ratio measures how directly price moves toward your target versus how much it wanders. A choppy, noisy market is inherently less efficient to trade and generates more cost per unit of profit captured.
Pro Tip: Calculate your total round-trip cost per trade by adding commission, average spread cost in dollar terms, and your average slippage over 50 trades. Compare that number to your average winner. If your cost-to-winner ratio exceeds 15%, cost efficiency should be a priority before strategy tweaks.
Factors that shape your trading costs
Understanding cost efficiency in trading requires knowing which variables actually move the needle. Some are outside your control. Most are not.

Liquidity and session timing
Market liquidity is the single biggest driver of bid-ask spreads. More buyers and sellers competing to fill orders means tighter spreads and less slippage. EUR/USD spreads vary dramatically by session: roughly 0.2 pips during the London-New York overlap versus 2.0 pips during the Asian low-liquidity window. That’s a 10x difference on the same currency pair, the same broker, the same account. Trading during illiquid hours is one of the most overlooked and easily fixed cost problems in retail forex.
Order types and execution method
- Market orders execute immediately but cross the full spread, guaranteeing a cost on every entry and exit.
- Limit orders set a specific price; if filled, you pay no spread cost and sometimes collect it. The tradeoff is the risk of a missed fill.
- Stop orders often trigger as market orders during fast markets, adding slippage on top of the spread.
- Stop-limit orders give price control but can leave you out of a move entirely if the market gaps through your level.
On EUR/USD with a 0.5 pip spread, a market order costs roughly $5 per standard lot. A limit order costs $0 if filled at your price. Switching half your entries to limit orders, even when possible only part of the time, makes a real difference over hundreds of trades.
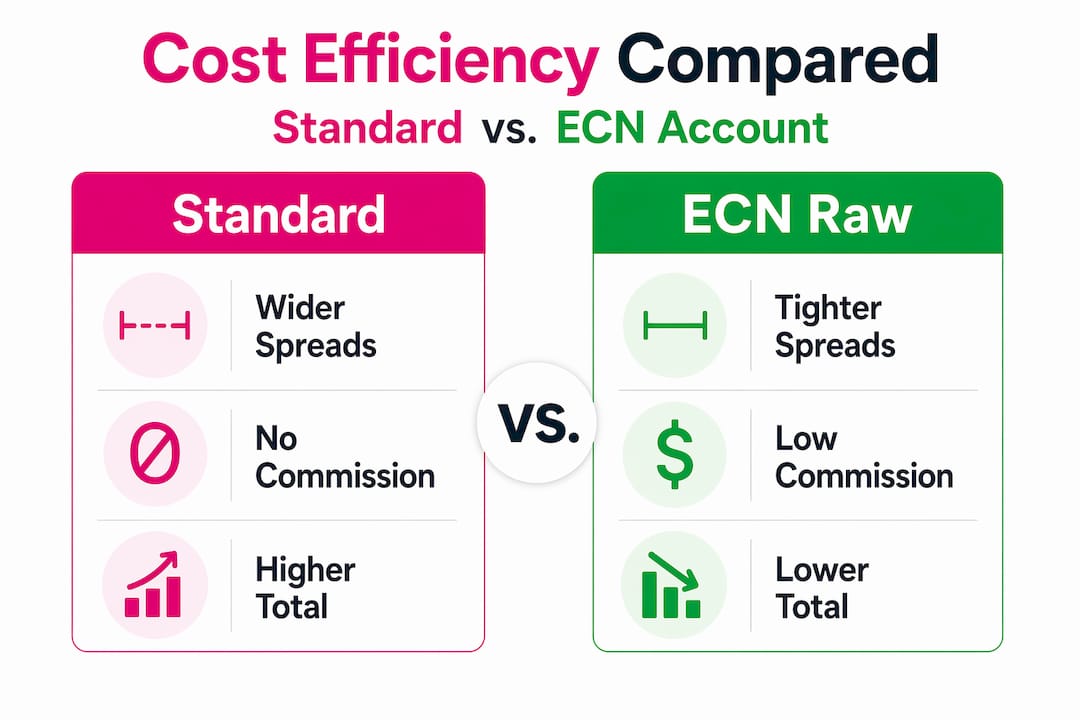
Broker account type
| Account Type | Commission | Spread | Total Cost |
|---|---|---|---|
| Standard markup | None | 1.2-2.0 pips | Hidden and high |
| STP/ECN raw spread | $3-7 per lot | 0.0-0.3 pips | Transparent and lower |
| Zero-commission retail | None | 1.5-3.0 pips | Misleadingly expensive |
Zero-commission broker accounts frequently cost traders 50-70% more in total execution costs due to wider spreads that stay invisible. Raw spread ECN accounts display an explicit commission but dramatically tighter spreads, reducing total cost by 30-40% in most comparisons.
Pro Tip: Ask your broker for a full cost breakdown per lot on your most-traded pair. Request both commission and average realized spread from their execution reports. Then run the same calculation for an ECN alternative. The comparison is usually eye-opening.
Volatility and news events
Trading during volatile periods around major news events increases implicit costs sharply. Slippage can add 0.5 to 3 pips per trade depending on conditions and broker execution quality. During a Non-Farm Payrolls release or a central bank decision, market orders become expensive by definition because liquidity temporarily collapses.
How to measure and reduce your trading costs
Reducing cost without first measuring it is guesswork. Here’s a practical framework for getting this right.
- Track total round-trip cost by recording commission, realized spread, and slippage for every trade in a spreadsheet or trading journal. Review the weekly average.
- Use the Efficiency Trading Statistic to evaluate execution quality. This metric measures the gap between actual and potential profit from your trades. Scores approaching 80% indicate good execution discipline.
- Switch to limit orders wherever your strategy allows entry near a predictable level. Even a 40% conversion rate from market to limit entries cuts spread costs substantially over a full month.
- Trade the right session for your pair. Match your activity to the hours when your target instrument is most actively quoted, typically the primary or overlapping sessions.
- Audit hidden fees regularly. Recurring small charges such as data subscriptions, wire fees, margin interest, and FX conversion charges can cumulatively exceed commissions for active traders who ignore them.
- Negotiate with your broker. Volume-based fee schedules are common, and brokers will often reduce commissions or raw spread markups for consistent high-volume traders who ask.
- Fix your strategy edge first. Cutting costs on a losing strategy delays the real problem. Cost optimization pays off most when applied to a strategy that already has positive expectancy.
Pro Tip: Before switching brokers for lower costs, run at least one full trading month on a demo account with the new broker’s typical spreads and execution conditions. Slippage behavior varies significantly between brokers even when advertised spreads look identical.
Common pitfalls and advanced considerations
Several patterns reliably push traders toward inefficiency, even when they believe they’re making smart decisions.
- The zero-commission trap. Many traders select brokers purely on commission. Standard markup accounts hide costs in wide spreads, and the true total execution cost is often higher than a comparable ECN account charging explicit commissions.
- Ignoring session liquidity. Trading a EUR pair during Asian hours, or a JPY pair during European dead hours, compounds spread and slippage costs unnecessarily. This is a structural cost that timing alone can eliminate.
- Overweighting ticket fees. Obsessing over a $1 difference in commission per lot while ignoring 0.5 pip slippage on a standard lot is misallocating attention. Slippage at that level costs $5 per trade and compounds fast.
- News event blind spots. Volatility spikes immediately around scheduled data releases are predictable. Yet many traders place market orders right at release time, accepting maximum implicit costs when they could wait 60 seconds for spreads to normalize.
“Timing and order type selection are often neglected levers in cost efficiency; patience in execution using limit orders can generate substantial savings.” — Trading cost research insight
On the measurement side, using execution benchmarks lets you compare your average fill quality against the best available price at the moment of your order. For systematic traders, the efficiency ratio in trading reveals whether noise is increasing with your timeframe, which affects both strategy performance and cost assumptions.
What cost optimization looks like in practice
Concrete numbers make this real. Consider two traders using the same EUR/USD strategy, each taking 100 trades per month on a standard lot.
| Cost Factor | Standard Account | ECN Raw Spread Account |
|---|---|---|
| Avg. spread cost | 1.5 pips ($15/lot) | 0.2 pips ($2/lot) |
| Commission | $0 | $6/lot |
| Total per trade | $15 | $8 |
| Monthly total (100 trades) | $1,500 | $800 |
| Annual difference | — | $8,400 saved |
Active retail traders applying tactics like raw spread accounts, limit orders, and session timing can save $200 to $800 monthly. The top three tactics deliver approximately 80% of total savings. That $700 monthly difference compounding over a full year represents real capital that stays in the account rather than going to the broker.
In crypto markets, the gap can be even more extreme. Zero-fee crypto exchanges often widen spreads by 1 to 3%, adding $100 to $300 in hidden costs on a $10,000 trade compared to transparent fee platforms. Fee tier differences between the lowest and highest volume tiers can be up to 60 times larger. The lesson applies across asset classes: always measure total cost, not headline fee.
Past results do not guarantee future performance. The savings figures above are illustrative based on typical market conditions and should not be treated as guaranteed outcomes for your account.
My take on what traders consistently get wrong
I’ve watched traders spend weeks back-testing strategy modifications that might improve returns by 2%, while carrying 8% annual cost drag they’ve never measured. That sequencing problem is almost universal.
In my experience, the first place to look is not commissions. It’s slippage, specifically whether your broker’s execution quality matches their marketing materials. I’ve seen traders move from a “low-cost” retail broker to an ECN provider and immediately recover 0.4 pips per trade in realized slippage, with no strategy changes at all. That’s the kind of improvement that shows up in your account statement, not just a spreadsheet.
The second thing I’d flag is the cost of impatience. Using market orders as a default, especially during news windows or thin Asian sessions, is essentially choosing to pay the maximum available cost every single time. Limit orders feel like they carry more risk because fills aren’t guaranteed. But for traders with defined entry levels, the math strongly favors patience.
What I’d caution against is cost obsession after a certain point. Once you’ve moved to an ECN account, aligned trading to liquid sessions, and switched to limit orders where your strategy allows, you’ve captured the majority of available savings. After that, fixating on another $1 per lot is less valuable than reviewing your execution logs weekly and catching the occasional slippage outlier before it becomes a pattern.
Track your costs monthly. Review your broker’s execution quality quarterly. And never confuse a zero-commission label with an actual low-cost account.
— Rimantas
How trade copying fits into a cost-efficient workflow
If you manage trades across multiple MetaTrader 4, MetaTrader 5, or DXTrade accounts, manual re-entry creates its own hidden cost. Every second of delay between your signal account and your client accounts is potential slippage, especially around fast-moving news events.
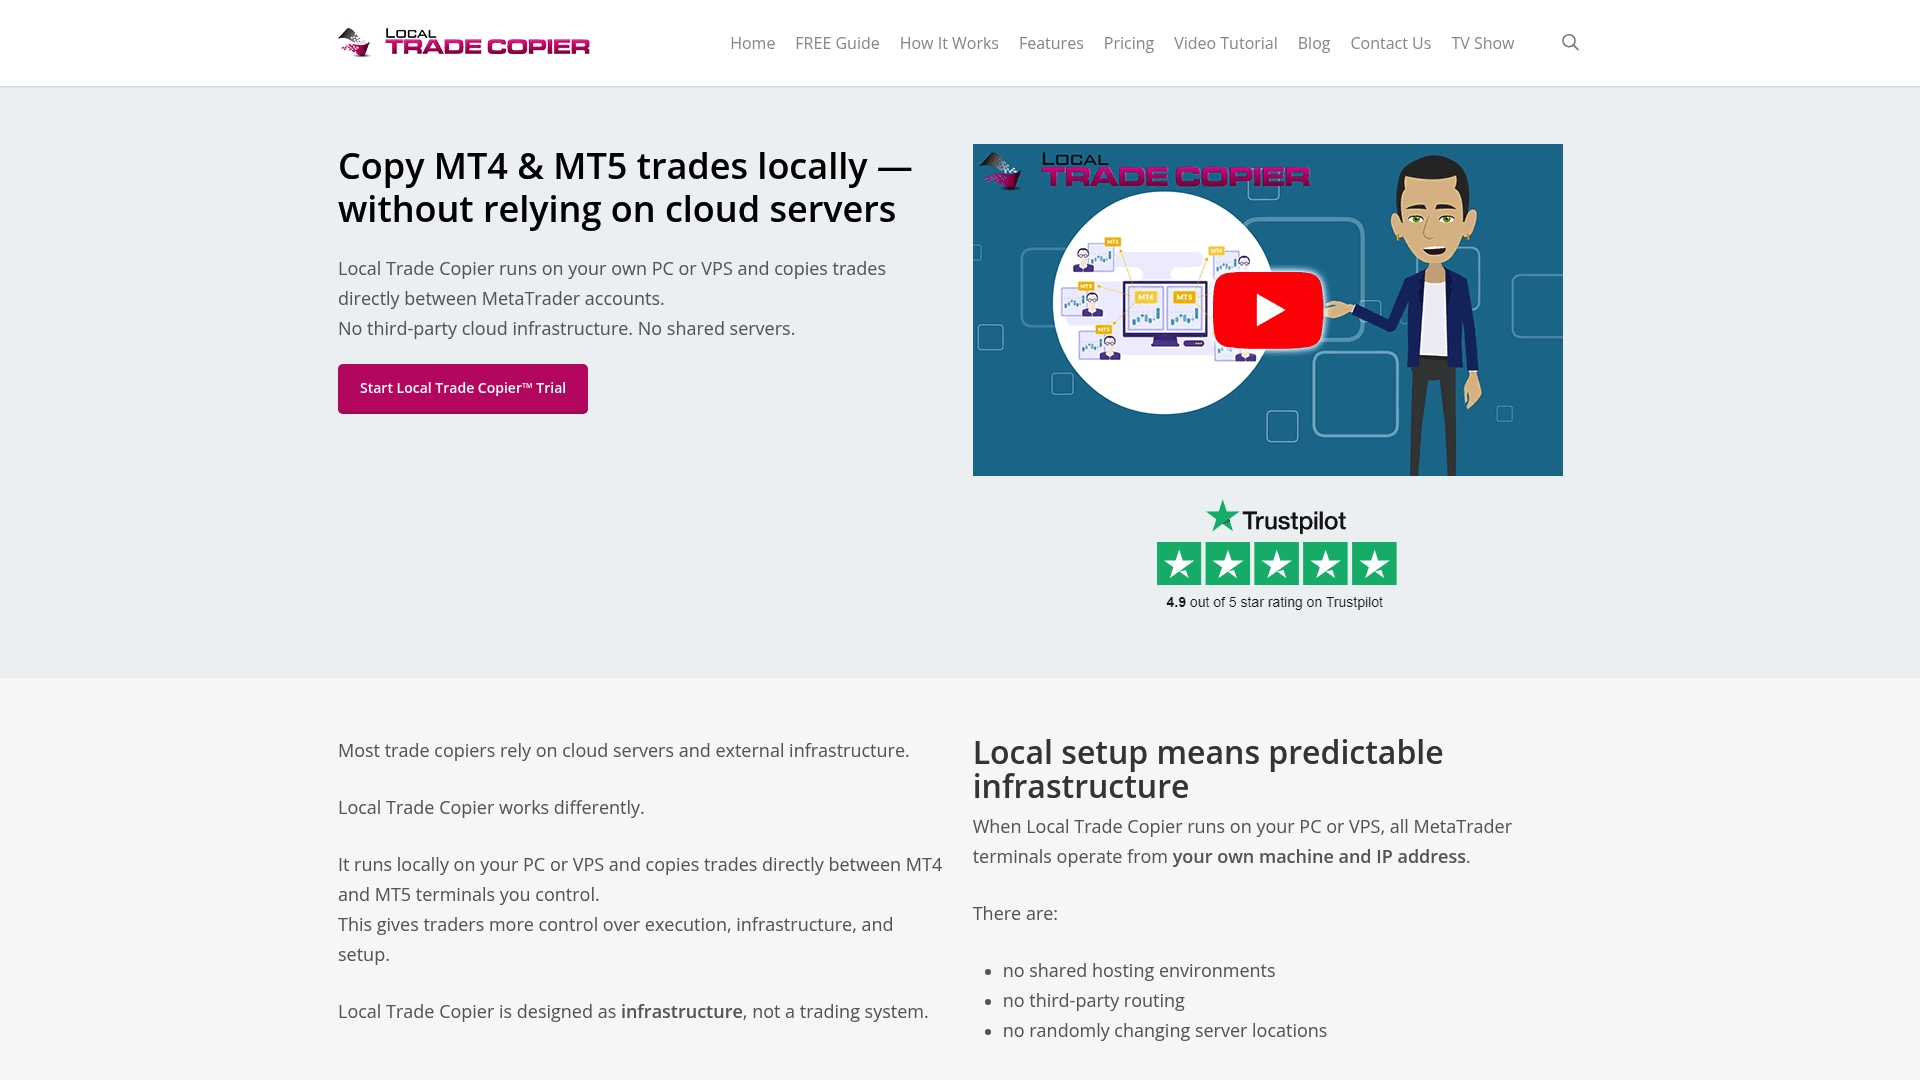
Mt4copier’s Local Trade Copier replicates trades across accounts in under 0.5 seconds, running entirely on your local machine with no cloud routing. That means no external latency, consistent execution timing across all accounts, and no IP detection risk for prop firm setups. You can explore how it works before committing, review the installation process, and see how features like stop loss management give you precise control over trade endings across every account you run. A 7-day free trial is available.
FAQ
What is trading cost efficiency in simple terms?
Trading cost efficiency measures how much of your gross profit remains after all transaction costs are paid, including spreads, commissions, and slippage. The closer your actual costs are to the theoretical minimum for a trade, the more efficient your execution.
What are the biggest hidden trading costs?
Bid-ask spreads, slippage, and session timing losses are typically larger than visible commissions for active traders. Hidden fees such as margin interest, FX conversion charges, and data subscriptions also add up significantly over time.
Does zero-commission always mean lower trading costs?
No. Zero-commission accounts frequently carry wider spreads that make total execution costs 50-70% higher than ECN accounts with explicit commissions and tight raw spreads.
How does session timing affect trading costs?
EUR/USD spreads can be 10 times wider during low-liquidity Asian sessions compared to the London-New York overlap. Trading during peak liquidity hours is one of the simplest ways to reduce implicit costs without changing your strategy.
How do I measure my trading efficiency?
Track total round-trip cost per trade including commission, realized spread, and slippage, and compare it to your average winning trade. The Efficiency Trading Statistic is a useful benchmark; scores near 80% indicate strong execution discipline.
Recommended
- Boost Trading Efficiency with Automated Trade Copying
- Trade copying best practices for efficient forex management
- Why speed matters in trade copying: boost profits & cut risk
- Master forex trading terms for efficient account management