Support and Resistance are fundamental concepts in the world of trading and investing. These terms are frequently used in technical analysis to make informed decisions in the financial markets. In this article, we will delve into the intricacies of Support and Resistance, why they are essential, how to identify them, and strategies to apply when trading.
Understanding the Basics
Before we explore the concept of Support and Resistance, it’s vital to comprehend the fundamentals of these terms.
What is Support?
Support is a price level at which an asset, whether it’s a stock, currency, or cryptocurrency, tends to stop falling and may even reverse its direction. Think of it as a safety net that prevents the asset’s value from plummeting further. Support represents a point where buyers outnumber sellers, creating demand and causing the price to bounce back.
What is Resistance?
Conversely, Resistance is the opposite of Support. It is a price level at which an asset tends to stop rising and may reverse its course. Resistance is where sellers outnumber buyers, leading to a halt in the asset’s upward momentum. This level acts as a barrier that the asset must overcome to continue its upward trend.
Why Support and Resistance Matter
Support and Resistance play a pivotal role in trading decisions. They are significant for several reasons.
- Decision-Making: Traders use these levels to determine entry and exit points for their positions. Knowing where Support and Resistance are located can greatly influence their choices.
- Risk Management: Identifying Support and Resistance levels is critical for setting stop-loss orders. This risk management strategy helps traders limit potential losses and protect their investments.
- Market Psychology: Support and Resistance levels often reflect the collective psychology of market participants. They offer insights into market sentiment, allowing traders to gauge market dynamics.
- Trend Identification: Understanding these levels is instrumental in determining whether an asset is in an uptrend, downtrend, or trading within a range. This information guides traders in developing appropriate strategies.
How to Identify Support and Resistance
Identifying these levels is a fundamental aspect of trading. There are various methods to do so, with the most common being technical analysis and the use of price charts.
Technical Analysis
Technical analysts rely on historical price data and chart patterns to identify Support and Resistance levels. They study charts to locate areas where an asset has reversed its direction multiple times.
Price Charts
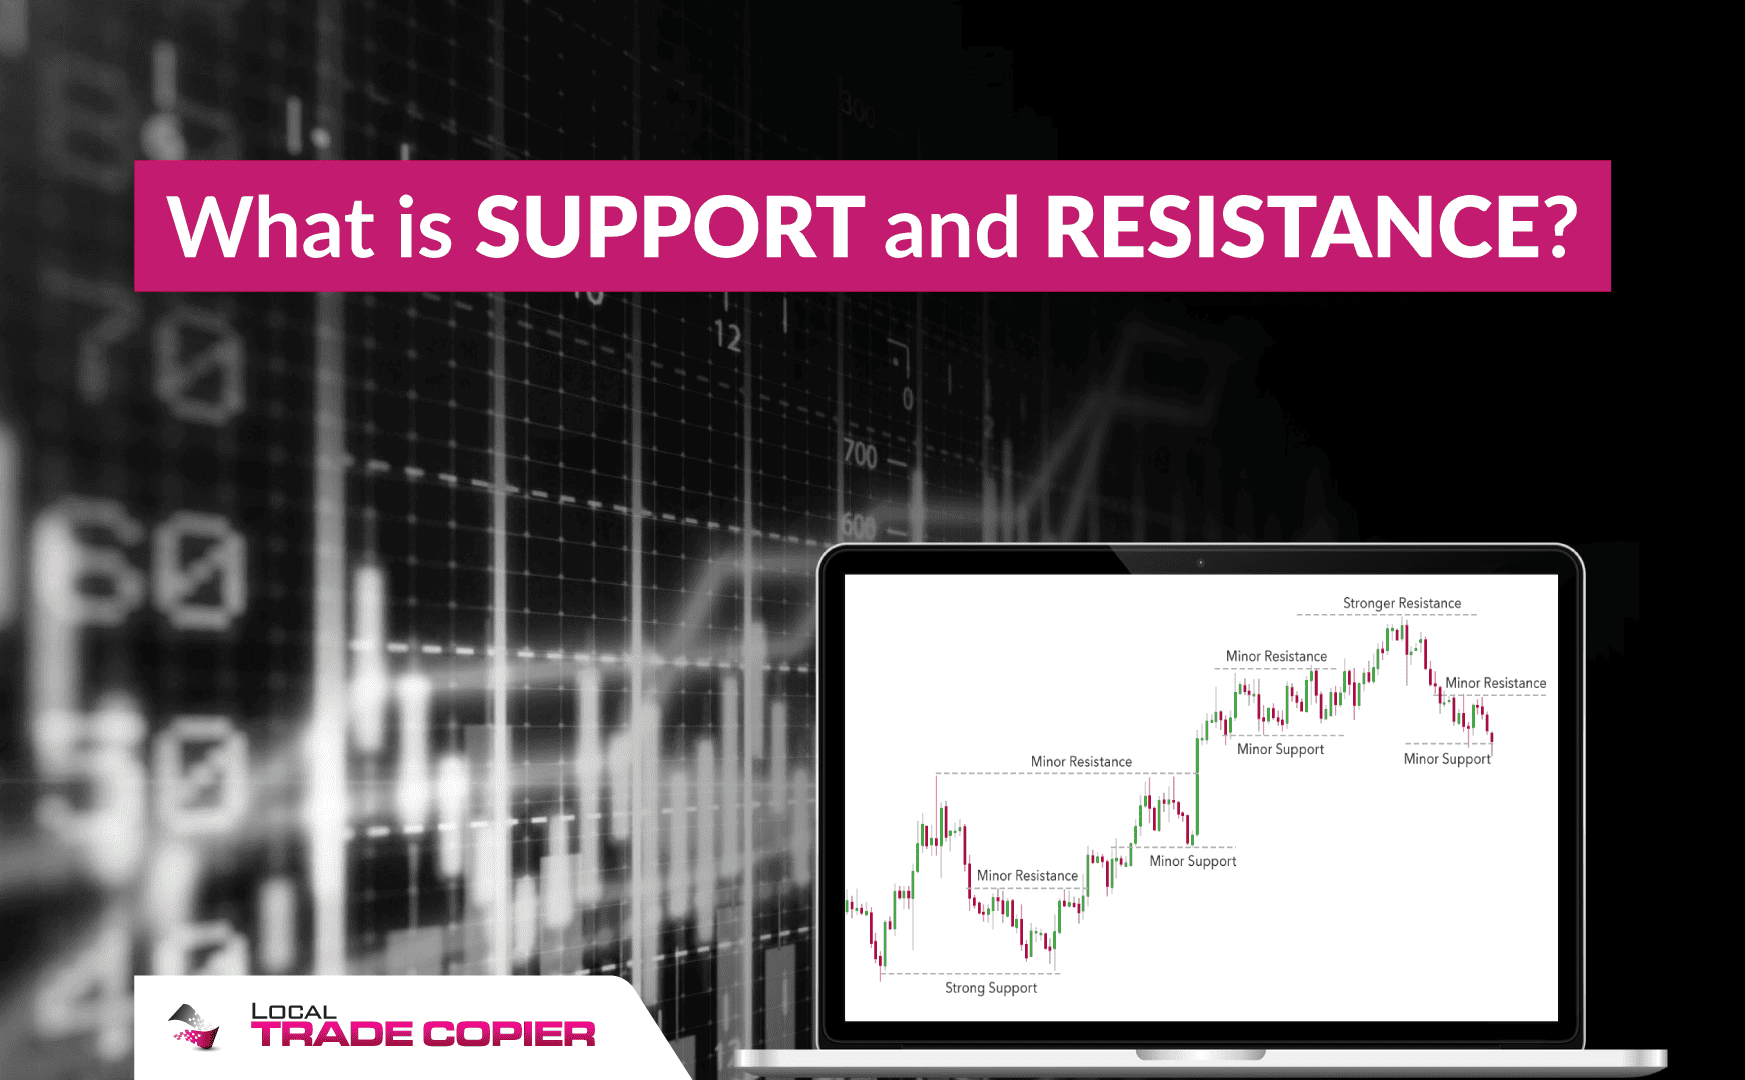
Price charts, especially candlestick charts, graphically display Support and Resistance levels. Traders look for patterns and trends in these charts to make well-informed trading decisions.
The Role of Psychological Levels
Psychological levels, such as round numbers like $100 or $50, often act as significant Support and Resistance levels. These levels are deeply rooted in human psychology and are considered robust barriers in trading.
Trader Sentiments
Psychological levels are heavily influenced by trader sentiments. When an asset approaches a round number, traders often become cautious, leading to increased selling and the formation of Resistance. Conversely, these levels can attract buyers, generating Support.
Support and Resistance in Action
To understand these concepts better, let’s explore a couple of real-life examples.
Real-Life Examples
Example 1: Apple Inc. (AAPL) Stock
Suppose the price of AAPL stock has been consistently dropping and reaches $120. At this level, many buyers step in, and the price starts rising, creating a Support level at $120.
Example 2: EUR/USD Currency Pair
In the foreign exchange market, if the EUR/USD currency pair consistently struggles to break through the $1.2000 level, it forms a Resistance, indicating a point where sellers are active.
Trading Strategies
Now that we understand Support and Resistance, let’s discuss some common trading strategies.
Breakout Trading
Breakout traders aim to profit from price movements when an asset breaks through a Support or Resistance level. They believe that such breakthroughs are indicative of strong momentum.
Range Trading
Range traders, on the other hand, aim to profit within the boundaries of Support and Resistance. They buy near Support and sell near Resistance, taking advantage of price oscillations.
Common Mistakes to Avoid
While Support and Resistance can be powerful tools, traders often make some common mistakes. It’s essential to be aware of these pitfalls to improve trading decisions.
Tools for Support and Resistance Analysis
Several technical indicators can assist traders in identifying Support and Resistance levels. These include Moving Averages, Pivot Points, and Fibonacci Levels.
Moving Averages
Moving Averages are trend-following indicators that smooth out price data. They help identify potential Support and Resistance areas by highlighting trends.
Pivot Points
Pivot Points are mathematical indicators used to determine potential turning points in the market. Traders often use them to identify key Support and Resistance levels.
Fibonacci Levels
Fibonacci retracement levels are based on a mathematical sequence and are used to predict potential Support and Resistance areas.
Support and Resistance in Different Markets
Support and Resistance principles are applicable across various financial markets, including stocks, forex, and cryptocurrencies.
Stocks
In stock trading, Support and Resistance levels are vital for decision-making and risk management.
Forex
Forex traders extensively use Support and Resistance to make informed trades in the highly liquid currency market.
Cryptocurrencies
Given the volatility of cryptocurrencies, understanding Support and Resistance is crucial for traders in this market.
The Evolution of Support and Resistance
The concept of Support and Resistance has evolved with advancements in technology and changes in trading strategies. It remains a cornerstone of technical analysis in modern finance.
Conclusion
Support and Resistance are integral components of technical analysis, offering valuable insights for traders and investors. These levels assist in making informed trading decisions, managing risk, and understanding market psychology. By mastering the art of identifying and utilizing Support and Resistance, traders can enhance their chances of success in the financial markets.
FAQs
1. Are Support and Resistance levels the same for all assets?
Ans. Support and Resistance levels vary depending on the asset and market conditions. What acts as Support for one asset might be Resistance for another.
2. Can Support and Resistance levels change over time?
Ans. Yes, Support and Resistance levels can change as market dynamics evolve. Traders should regularly analyze and adjust their strategies accordingly.
3. How can beginners start using Support and Resistance in their trading?
Ans. Beginners can start by studying historical price charts, identifying key levels, and practicing with demo accounts to understand how these levels work.
4. Are there automated tools to identify Support and Resistance?
Ans. Yes, there are various technical indicators and trading platforms that provide automated Support and Resistance analysis.
5. Do Support and Resistance levels work in all market conditions?
Ans. While Support and Resistance are valuable, they may be less effective in extremely volatile markets. Traders should consider other factors in such situations.