Welcome to the fascinating world of trading and technical analysis! If you’re a novice trader or even an experienced one, you’ve probably heard about Fibonacci retracement levels. These mystical-sounding levels are not some magical incantations, but rather powerful tools that traders use to decode the language of the financial markets. In this article, we’ll take a deep dive into the world of Fibonacci retracement levels. We’ll unlock the secrets behind these levels, exploring what they are, how they are calculated, and most importantly, how they can guide you in your trading journey.
What Are Fibonacci Retracement Levels?
Imagine you’re on a treasure hunt and stumble upon a map with intricate lines and numbers. That’s essentially what a Fibonacci retracement chart looks like. It’s a map that traders use to navigate the complex terrain of price movements in financial markets. These levels are derived from a mathematical concept known as the Fibonacci sequence, which dates back to the 13th century and was introduced by the Italian mathematician Leonardo of Pisa, also known as Fibonacci.
The Fibonacci Sequence
Let’s start with the foundation of it all – the Fibonacci sequence. It’s a numerical series where each number is the sum of the two preceding ones. It begins with 0 and 1 and goes like this: 0, 1, 1, 2, 3, 5, 8, 13, 21, and so on. This sequence forms the basis of Fibonacci retracement levels.
How Are Fibonacci Retracement Levels Calculated?
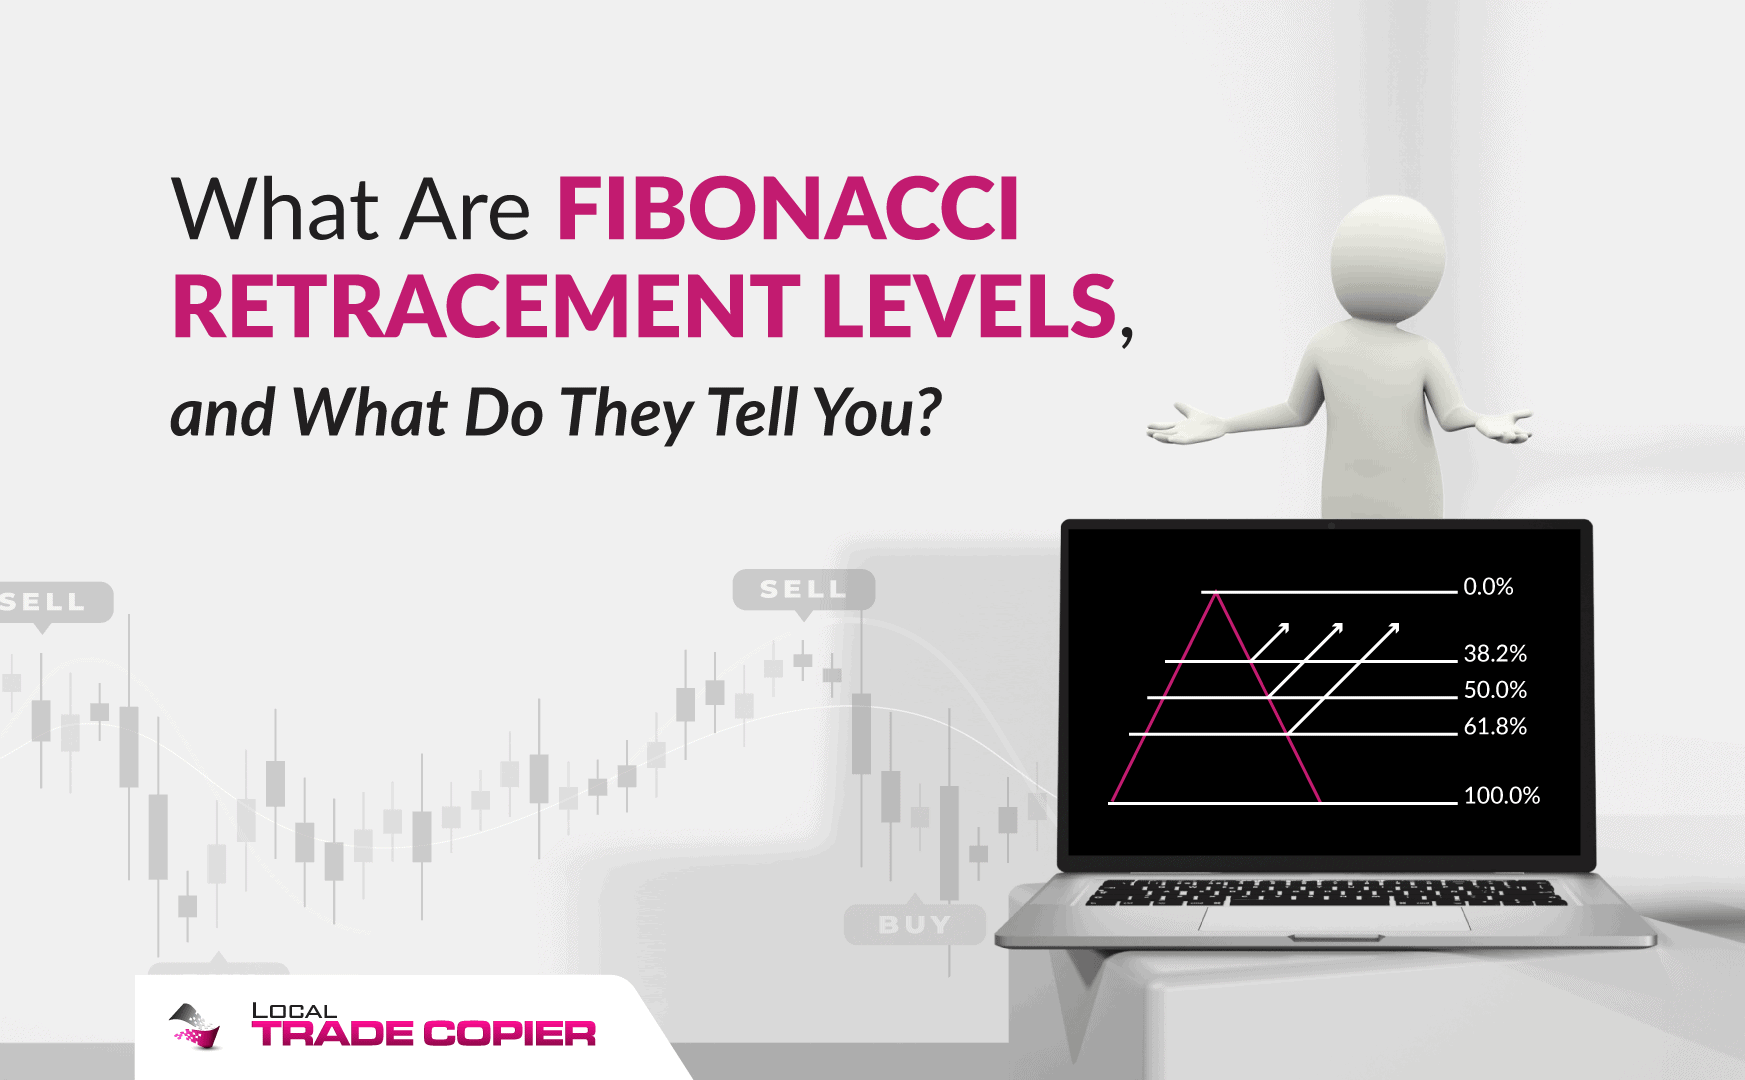
Now that you have a glimpse of the backstory, let’s dive into the nitty-gritty of how these levels are calculated. The key to unlocking Fibonacci retracement levels lies in identifying the high and low points of a price movement. Once these points are determined, you can start drawing horizontal lines on a price chart to reveal potential areas of support and resistance. These lines are represented as percentages, and the crucial retracement levels are 23.6%, 38.2%, 50%, 61.8%, and 100%.
The Key Fibonacci Retracement Levels
- 23.6%: This level marks a shallow retracement and is often seen as the first line of defense for a trend. Think of it as a subtle hint from the market.
- 38.2%: The 38.2% level is like a guard dog, barking louder to warn you of potential reversals or corrections within a trend.
- 50%: While not a Fibonacci number itself, the 50% level carries psychological significance. It’s like a checkpoint on your trading journey, a moment of reflection for the market.
- 61.8%: Ah, the “golden ratio.” This level is considered a treasure trove for traders. When the price retraces to 61.8%, it often indicates a significant turning point.
- 100%: The 100% level is like a full circle, indicating a complete retracement of the prior move, suggesting a return to square one.
How Traders Use Fibonacci Retracement Levels
Now that you know these levels, let’s explore how traders put them into action.
Identifying Support and Resistance
Think of Fibonacci retracement levels as the secret codes on a treasure map. When the price retraces to one of these levels and bounces off, it’s like finding hidden treasure. Traders use these levels to identify strong support or resistance areas.
Confirming Trends
Traders rarely rely on a single tool. Fibonacci retracement levels are often used alongside other technical indicators to confirm the direction of a trend. When a retracement aligns with an existing trend, it’s akin to finding multiple clues that lead you in the same direction.
Managing Risk
In the world of trading, risk management is paramount. Traders set stop-loss orders just below key Fibonacci retracement levels to limit potential losses. Conversely, they may set take-profit orders near these levels to secure profits. It’s like using a compass to stay on course and a life jacket to stay afloat.
Conclusion
In the vast sea of financial markets, Fibonacci retracement levels act as a reliable compass, guiding traders through treacherous waters. They may not be magical, but they are powerful tools that help traders make informed decisions. Armed with the knowledge of these levels, you can better understand price movements, identify potential turning points, and ultimately, improve your trading strategies.
FAQ’s
1. Are Fibonacci retracement levels foolproof?
Ans. No, they are not foolproof. While they are incredibly useful, traders should always use them in conjunction with other indicators and risk management strategies.
2. Can Fibonacci retracement levels be used in any financial market?
Ans. Yes, they are versatile and can be applied to various financial markets, including stocks, forex, cryptocurrencies, and commodities.
3. Do I need to be a math whiz to use Fibonacci retracement levels?
Ans. Not at all. Most trading platforms offer tools to draw Fibonacci retracement levels automatically, making it accessible to traders of all backgrounds.
4. Are there variations of Fibonacci retracement levels?
Ans. Some traders use extensions of the retracement levels, such as 161.8% and 261.8%, for more precise analysis.
5. What other technical indicators complement Fibonacci retracement levels?
Ans. Popular indicators like moving averages, RSI (Relative Strength Index), and MACD (Moving Average Convergence Divergence) can be used alongside Fibonacci retracement levels for comprehensive analysis.