TL;DR:
- Trade signal distribution maps how signals cluster across time, price, and probability, revealing system behavior under market regimes. Understanding this helps traders evaluate strategy consistency, risk exposure, and calibration, improving decision-making. Regularly analyzing distribution shifts allows timely adaptation to prevailing market conditions, enhancing trading edge and performance.
Trade signal distribution is defined as the pattern and frequency with which individual trade signals occur across time, price levels, and probability confidence bins, revealing how a trading system behaves under different market conditions. Most traders focus on whether a signal is a buy or a sell. The traders who consistently evaluate their systems look deeper, at where those signals cluster, how often they fire, and what confidence level each one carries. Understanding this concept transforms raw signal data into a structured picture of strategy behavior, risk exposure, and timing quality. Tools like Chaikin Money Flow (CMF), probability calibration curves, and market profile analysis each contribute to this picture in distinct ways.
What is trade signal distribution and why does it matter?
Trade signals are explicit triggers to buy or sell, generated from technical indicators or algorithms with actionable parameters like entry price, stop loss, and timing. Signal distribution, then, is not a single metric. It is the aggregate pattern of how those triggers are spread across dimensions such as hour of day, price range, market phase, and probability band.
This matters because a system that fires 40 signals in a trending week and 4 in a ranging week is not behaving consistently. That clustering tells you something critical about the strategy’s dependency on market regime. Without measuring distribution, you cannot distinguish a genuinely edge-rich system from one that only works in specific, rare conditions.
The industry term for this analysis is signal distribution analysis, and it sits at the intersection of backtesting, probability theory, and market structure. Forex traders who understand how signals work across MetaTrader 4, MetaTrader 5, and DXTrade platforms are better positioned to evaluate whether a signal provider or automated system is worth trusting. Past results do not guarantee future performance, but distribution data gives you the most honest view of what a system actually does.
How is trade signal distribution measured and analyzed?
Distribution analysis breaks down along three primary axes: time, price, and probability. Each axis answers a different question about your signal system.

Time-based distribution maps when signals fire. A system generating most signals during the London session overlap but almost none during the Asian session is not broken. It is regime-dependent. Knowing this lets you allocate capital and attention more precisely.
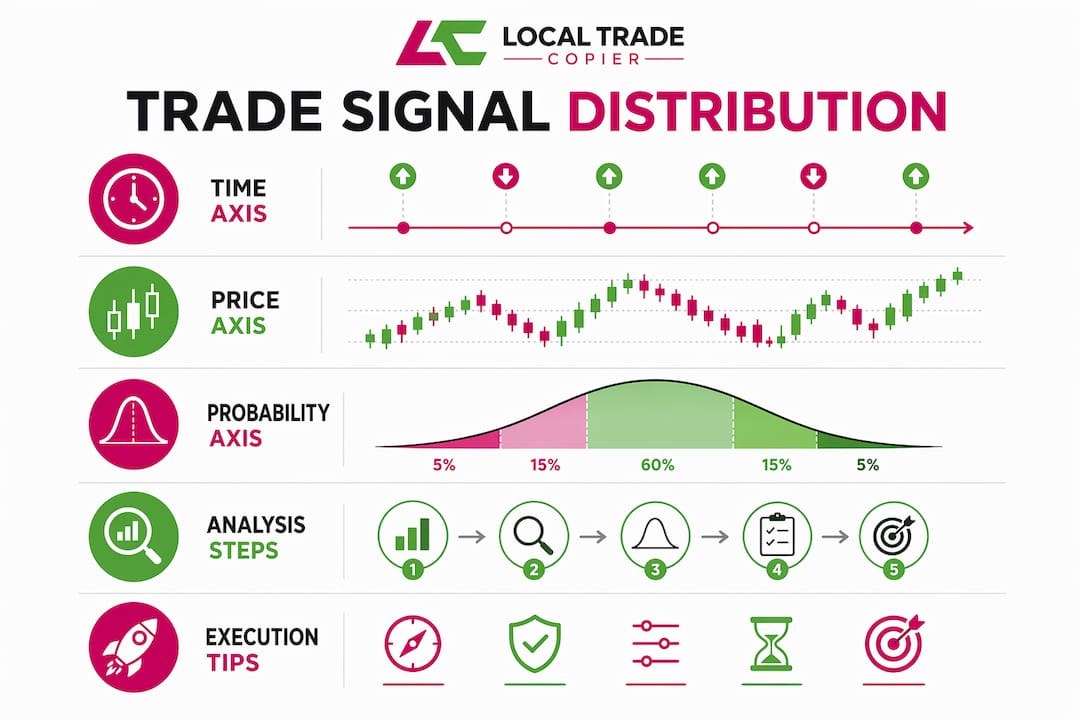
Price-based distribution shows where in the price range signals cluster. If your system consistently triggers near round numbers or key support zones, that pattern is worth knowing before you size positions.
Probability-based distribution is the most sophisticated axis. Probabilistic forecasting models use probability calibration, validated by reliability curves, so forecasted probabilities correspond to realized win rates. This means a signal labeled “70% confidence” should win approximately 70% of the time when measured across a large sample. Without calibration, that label is meaningless.
The Chaikin Money Flow indicator is one of the most referenced tools for measuring accumulation and distribution pressure. CMF measures accumulation vs. distribution by analyzing where the close falls in the day’s range combined with volume. CMF ranges from -1 to +1, with positive values indicating buying pressure and negatives indicating selling pressure. That reading tells you whether the market is in a phase where long signals are likely to cluster or short signals dominate.
Here is a comparison of the main distribution measurement techniques:
| Technique | What it measures | Best used for |
|---|---|---|
| Chaikin Money Flow (CMF) | Accumulation vs. distribution pressure via price position and volume | Identifying signal regime (long-biased vs. short-biased) |
| Probability calibration curves | Alignment between forecasted confidence and realized win rate | Validating probabilistic signal systems |
| Backtesting frequency analysis | Signal count per time window, price zone, or market condition | Detecting clustering and regime dependency |
| Market profile distribution | Value area and bell-curve shape of price acceptance | Mapping where mean-reversion vs. trend signals are likely |
Pro Tip: Before trusting any signal distribution analysis, run a backtesting tool on at least 200 signal occurrences. Fewer than that and clustering patterns are statistically unreliable.
What factors influence signal distribution in trading strategies?
Signal distribution is not static. It shifts with market structure, and traders who treat it as a fixed property of their system will be caught off guard when conditions change.
Market profile distributions reflect market regimes as single, double, or multiple bell-shaped curves representing accepted value zones or value migration. A single distribution indicates a balanced, mean-reverting market where fade signals cluster near extremes. A double distribution signals a shift in value acceptance, often producing breakout signals at the transition zone. Multiple distributions align with trending behavior, where signals step progressively in one direction.
The Forex market also cycles through structural phases that directly shape signal frequency and type. Forex market structure cycles through accumulation, uptrend, distribution, and downtrend phases, each with characteristic signal types such as Break of Structure and Change of Character. Signals cluster differently by phase, which means a system optimized for trending conditions will produce a very different distribution profile during accumulation.
Several additional factors shape distribution in ways traders often overlook:
- Signal completeness: A complete trade signal includes instrument, direction, entry price, stop loss, and targets. Incomplete signals, those missing stop loss or target data, cannot be meaningfully distributed across probability bins or used for expectancy calculations.
- Autocorrelation effects: CMF-style indicators average accumulation/distribution over rolling windows, often 21 periods, generating autocorrelation and regime-dependent signal clusters. This means signals in a distribution phase tend to beget more distribution signals, not randomly scattered ones.
- Calibration pitfalls: Uncalibrated probability models produce misleading confidence scores even when directional rankings are reasonable. A model showing 80% confidence on every trade is not well-calibrated. It is overconfident, and sizing positions based on that number will distort your risk exposure.
- Regime shifts: When the market transitions from accumulation to distribution, signal frequency and type change abruptly. Traders who monitor distribution patterns can detect these shifts earlier than those watching price alone.
Pro Tip: Treat signal distribution as a rolling state, not a fixed property. Recalculate your distribution metrics every 20 to 30 trading sessions to catch regime changes before they damage your equity curve.
How can Forex traders apply distribution analysis to improve execution?
Applying signal distribution analysis to real trading decisions follows a clear sequence. Here is how to build that process:
- Normalize your signal data. Every signal must be recorded with a full parameter set: instrument, direction, entry price, stop loss, target, and timestamp. Without this structure, distribution analysis produces noise, not insight.
- Segment signals by probability bin. Group signals into confidence bands such as 50 to 60%, 60 to 70%, and 70 to 80%. Measure the realized win rate within each band. If your 70% bin is actually winning 55% of the time, your model needs recalibration before you size positions based on confidence.
- Map signal frequency by market phase. Use CMF readings alongside your signal log to identify whether signals fired during accumulation, distribution, or trending phases. This tells you which phase your system is actually designed for, regardless of what the marketing says.
- Adjust position sizing by distribution quality. Signals from well-calibrated, high-confidence bins warrant larger positions. Signals from poorly calibrated or low-frequency bins warrant reduced exposure. This is how distribution analysis connects directly to risk management. Past results do not guarantee future performance, but calibrated sizing is more defensible than flat lot sizing.
- Evaluate signal providers using distribution data. Any signal provider worth using should be able to show you their signal frequency by market condition, their calibration curve, and their distribution across time and price. If they cannot, you are buying a black box.
- Monitor for regime shifts. A sudden spike in signal frequency or a shift from long-biased to short-biased distribution is an early warning that market structure has changed. Tools like trade signal software can help automate this monitoring.
The practical payoff is significant. Traders who apply distribution analysis stop chasing signals in the wrong market phase and start allocating capital where their system has demonstrated genuine edge.
How do probabilistic signals differ from binary signals in distribution?
Binary trade signals produce a simple output: buy or sell. Probabilistic trade signals output a calibrated confidence score, such as a 68% probability of a bullish move within the next session. The distribution profiles of these two signal types look completely different, and they require different interpretation frameworks.
Binary signal distribution is measured by frequency and outcome rate across time and price bins. You are counting occurrences and wins. Probabilistic signal distribution adds a third dimension: confidence level. You are now measuring whether the stated confidence matches the actual win rate across a large sample, which is what a reliability curve tests.
Calibration error and reliability curves are critical diagnostics so traders can interpret signal distributions meaningfully, avoiding distortion from overconfident or underconfident probability assignments. Proper calibration underpins confidence-weighted position sizing and structured filtering of trades by probability band.
Here is how the two signal types compare across key metrics:
| Metric | Binary signals | Probabilistic signals |
|---|---|---|
| Output format | Buy / Sell flag | Confidence score (e.g., 72%) |
| Distribution axis | Time and price frequency | Time, price, and probability bin |
| Position sizing input | Fixed or rule-based | Confidence-weighted |
| Calibration requirement | Low | High |
| Regime sensitivity | Moderate | High |
| Misinterpretation risk | Low | High if uncalibrated |
Machine learning models used in Forex signal generation are particularly prone to calibration errors. A model can rank signals correctly in terms of direction while still assigning wildly inaccurate confidence scores. Traders using these systems without checking reliability curves are essentially flying blind on position sizing, which is where most of the real risk lives.
Key takeaways
Trade signal distribution is the foundational framework for evaluating whether a signal system has genuine edge, consistent behavior, and reliable calibration across market conditions.
| Point | Details |
|---|---|
| Core definition | Signal distribution maps how trade signals cluster across time, price, and probability dimensions. |
| CMF as a regime tool | Chaikin Money Flow identifies accumulation vs. distribution phases, directly shaping signal clustering patterns. |
| Calibration is non-negotiable | Probabilistic signals require reliability curve validation before confidence scores can inform position sizing. |
| Signal completeness matters | Signals missing stop loss or target data cannot be meaningfully distributed or used for expectancy analysis. |
| Distribution shifts with regime | Market profile transitions between single, double, and multiple distributions change where and how signals fire. |
Why most traders are looking at signal distribution backwards
I have spent years watching traders evaluate signal systems by win rate alone. They see 60% winners and call it good. What they miss is the distribution story underneath that number.
The most revealing thing I have found is that a system’s distribution profile tells you more about its real-world durability than any summary statistic. A system with a 60% win rate that fires 80% of its signals during one specific market phase is not a 60% system. It is a highly conditional system that will look broken for months at a time when that phase is absent.
The other mistake I see constantly is treating CMF readings as standalone signals rather than as regime context. CMF tells you whether accumulation or distribution pressure is dominant. It does not tell you when to enter. Traders who conflate those two things end up with entries that fight the prevailing pressure, which is a reliable way to erode an edge.
My honest recommendation: before you evaluate any signal provider or automated system, ask for their signal distribution data segmented by market phase. If they cannot produce it, that absence is the answer. And if you are building your own system, normalize every signal with a full parameter set from day one. Retrofitting that structure onto historical data is painful and often produces gaps that invalidate the analysis.
The traders who get this right are not necessarily smarter. They are just more systematic about what they measure.
— Rimantas
Copy distributed trade signals across accounts with Mt4copier
Once you understand your signal distribution and have a system worth trusting, the next practical challenge is execution across multiple accounts.

Mt4copier is a locally installed Expert Advisor that replicates trades from a master account to one or more client accounts across MetaTrader 4, MetaTrader 5, and DXTrade, with sub-0.5-second execution and no cloud routing. For traders managing multiple funded accounts or copying signals to clients, this means every signal fires consistently and simultaneously, with configurable lot sizing per account. The software includes stop loss and take profit management built into the replication process, so complete signals, the kind that make distribution analysis meaningful, are preserved exactly as intended. Mt4copier has been active since 2010 and serves over 3,000 users. A 7-day free trial is available with no cloud dependency required.
FAQ
What are trade signals in Forex trading?
Trade signals are explicit buy or sell triggers generated from technical indicators, algorithms, or analysis, with defined parameters like entry price, stop loss, and timing. They are designed to be mechanical and remove emotional decision-making from trade execution.
How does Chaikin Money Flow relate to signal distribution?
CMF measures whether a market is in an accumulation or distribution phase by combining price position within the daily range and volume. This regime context directly influences where and how frequently trade signals cluster, making CMF a useful tool for interpreting signal distribution patterns.
What is probability calibration in trade signal analysis?
Probability calibration is the process of aligning a model’s forecasted confidence scores with actual realized win rates, validated through reliability curves. A well-calibrated signal labeled 70% confidence should win approximately 70% of the time across a large sample.
Why do incomplete trade signals distort distribution analysis?
Signals missing stop loss or target data cannot be assigned to probability bins or used for expectancy calculations. Consistent, complete signal parameters are required for valid distribution measurement and realistic performance evaluation.
How do market profile distributions affect signal clustering?
Single distributions indicate balanced, mean-reverting markets where fade signals dominate. Double distributions signal value area shifts that produce breakout signals. Multiple distributions align with trending behavior, where signals step progressively in one direction across sessions.
Recommended
- How To Copy Forex Signals | MT4Copier.com
- Trade Copier | MT4 MT5 DxTrade | Forex Copy Trading Software
- How forex trade signals work: guide for MT4 and DXTrade
- Trade Copier | MT4 MT5 DxTrade | Forex Copy Trading Software